
InSAR Norway is a ground motion monitoring service based on satellite radar data. The basic principles of Synthetic Aperture Radar (SAR) are explained in the following sections.
What is a Synthetic Aperture Radar (SAR) image?
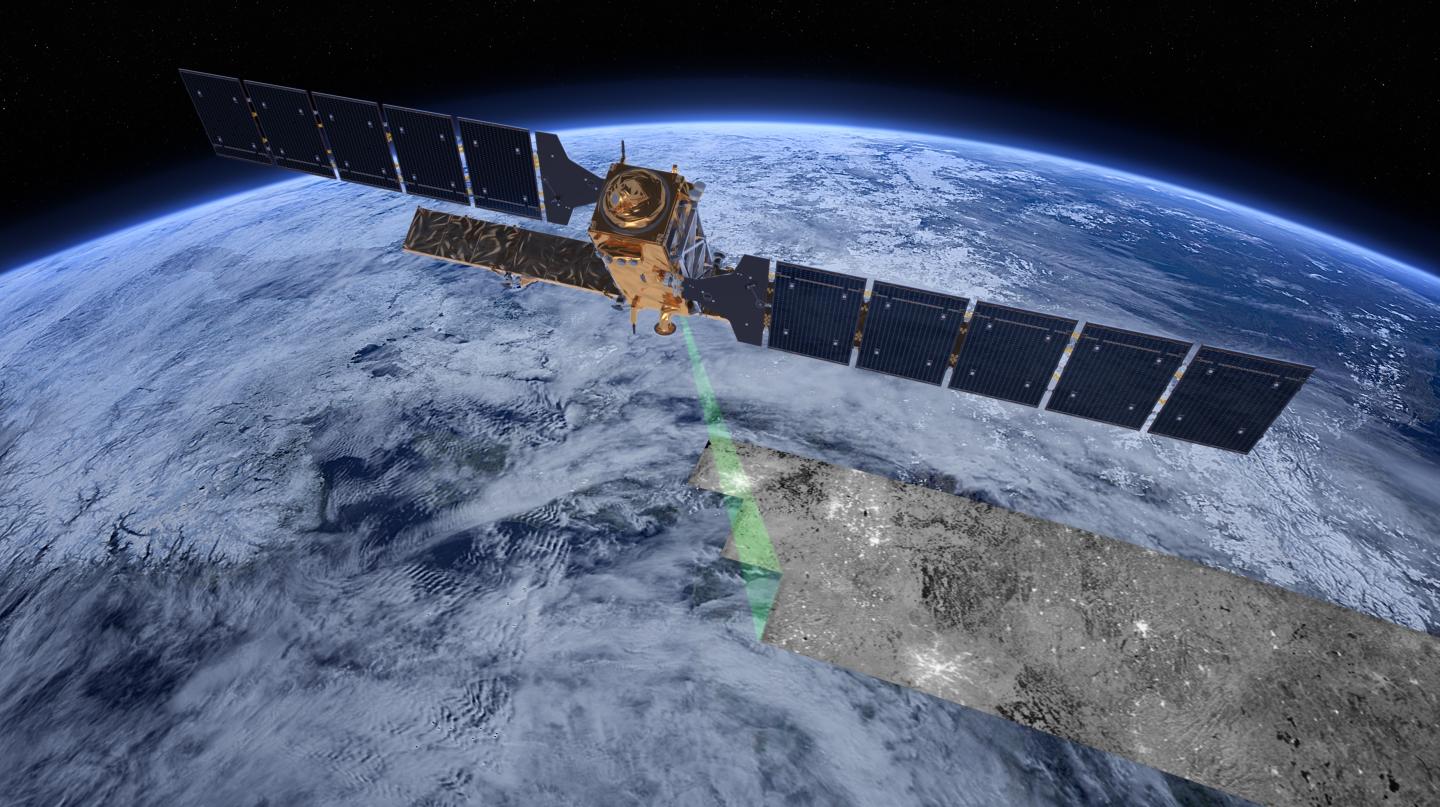
Synthetic Aperture Radar (SAR) is an active radar that uses microwaves to take pictures of the Earth’s surface. The SAR radar sends an electromagnetic signal and receives the signal reflected from the Earth’s surface. SAR sensors can penetrate clouds and collect images in all weather conditions, day and night.
The reflected signal is converted into a two-dimensional image (azimuth x slant range) parameterized in radar coordinates. The azimuth dimension is parallel to the satellite flight path, while the slant range dimension is perpendicular to the satellite flight direction. The spatial resolution of radar data directly depends on the sensor’s wavelength and antenna size.
The ground resolution of SAR images varies from satellite to satellite: For Sentinel-1 (European Copernicus program), it is about 5 x 20 meters (about 5 meters in range (about east-west direction) and 20 meters in slant range (about north-south direction).
Each pixel value in a radar image consists of the sum of reflected signals from all the individual reflectors located in this pixel. The signal in each pixel is a complex value consisting of two types of information:
- Amplitude indicates the power of the backscattering signal. It is proportional to the surface reflectance, which depends on the surface roughness, geometry, wetness, and dielectric constant of the target. A strong signal could, for example, be reflected from a hard material such as a rock outcrop on a mountain slope or a rooftop facing the radar signal. In contrast, weak amplitude signals are received from areas without clear reflectors and soils with high moisture content, such as bogs.
- A radar wave is cyclical. The phase corresponds to a proportion of the wave within this cycle, i.e., a fraction of the wavelength (which is typically about 5.6 cm for the SAR satellites used in InSAR Norway). The phase is related to the distance between the satellite and the Earth’s surface. This component of the SAR images is used to calculate ground motion.
What is the measurement geometry of a SAR satellite?
Most Earth observation satellites are in near-polar orbits, in which the satellite passes above or nearly above the North and South Poles. During the ascending pass, the satellite travels northwards on one side of the Earth, and during the descending pass, the satellite travels towards the southern pole.

Most satellite radar systems use a right side looking imaging geometry in the direction of the satellite orbit. Therefore, the azimuth angle is different for ascending and descending data.
Most satellite radar systems use a right-side-looking imaging geometry in the direction of the satellite orbit. Therefore, the azimuth angle is different for ascending and descending data. The satellite scans a 250 km wide swath of the Earth’s surface during each pass. The incidence angle (the angle between the satellite’s look direction and vertical) varies from about 30° along the edge of the swath closest to the satellite to 45° along the distal edge.
SAR measurements are one-dimensional, along the radar’s line-of-sight (LOS)
In the map service, InSAR Norway information about the satellite’s geometry for each measurement point can be found in the deformation time series plot window.


What is Synthetic Aperture Radar Interferometry (InSAR)??
Synthetic Aperture Radar Interferometry (InSAR) is a radar technique to measure displacement. From the images of a point taken at different times, we estimate the relative movement on the ground with millimetre accuracy..
We do this by measuring the phase difference (fraction of the wavelength) between two radar images.
The phase corresponds to the stage of the wave within this cycle, i.e., a fraction of the wavelength. When a point on the ground moves, the distance between this point and the radar sensor will change. This movement will change the phase signal detected by the sensor. An interferogram is a map that provides the spatial distribution of phase differences over two timepoints


The phase of the SAR signal is affected by more than just ground movement. Other factors include:
• Atmospheric variation: Change in the atmosphere leads to phase changes. Data from weather models can be used to remove the influence of atmospheric variations, but models cannot predict all atmospheric contributions. By assuming these variations are not time-dependent, we can filter them out using long data series.
• Topographic component: The influence of the topography can be removed by using, for example, a digital terrain model (DTM). Remains of topographic contributions due to inaccurate DTMs, such as buildings not included in the model, must be estimated to give a correct 3D position of each pixel.
• Other: A diminished quality of phase measurements can occur due to changes in vegetation, soil moisture and surface water, ice or snow, and sudden, large ground surface changes.
Since several unknown variables may affect the phase, the challenge is to distinguish the variables. To isolate the motion, the other elements of the phase difference must be removed. For this task, more than one interferogram is required. Therefore, we use multiple interferograms based on a time series of SAR images from the same satellite geometry so that we can:
- Capture variations in movement over time.
- Reduce noise levels (for example, filtering out the atmospheric contribution).
- Identify points with stable surface characteristics that can give more reliable measurements.
InSAR Norway Sentinel-1 national data sets are processed using Persistent Scatterer Interferometry (PSI), using software developed by NORCE Norwegian Research Center AS (formerly Norut) in Tromsø. PSI takes advantage of small, distinct points on the ground, which reflect very stable values over time. Such points can either be built objects or natural features; for example, building roofs, stone pavement, and other hard objects. The method, therefore, performs well in urban areas and on bare mountains slopes. Radarsat-2 regional datasets were processed using another technique called Small Baseline Subset (SBAS), which sums the contribution of several elements in a pixel to improve signal quality. Several pixels are averaged, resulting in a dataset with lower resolution than the original SAR images.
Which movements do we measure with InSAR?
IInSAR produces a database of measured points. An average velocity of movement is estimated for each point. The measurements are one-dimensional along the line-of-sight (LOS) and expressed as millimetres per year(mm/year). For each measurement point, there is also a time series consisting of LOS measurements of the movement for each available acquisition date. Each point also includes other information, such as the position of the point in three dimensions, LOS vector, quality measurements, etc.
A description of the data provided for the individual points can be found here
InSAR movement is relative to a local reference point and a reference time. The data is not yet linked to a fixed spatial reference. Currently, data is processed in smaller areas where each tile (20km x 86 km) has its own reference point. Before the areas are combined into the nationwide data sets, each area is adjusted so that most of the points in an area have a movement of 0 mm/year. This means that the map only shows relative and local deformation. The long-term aim is to connect InSAR data with data from GNSS (Global Navigation Satellite Systems) stations from the Norwegian Mapping Authority so that all motion is expressed with respect to the same absolute geodetic reference frame. The movement is also related to a reference time that varies across datasets and regions. This may, for example, be the first image of the entire series.
Further explanations of InSAR data properties and limitations can be found here. LINK 2
How do ascending and descending geometries affect InSAR data?

A movement to the east can give a negative value in the ascending data and a positive value in descending data. Conversely, a movement to the west gives a positive value in ascending and a negative value in descending data.
This outcome can be illustrated with an example of two unstable slopes on either side of the Sørfjord in Troms and Finnmark. The section on the west bank of the fjord moves to the southeast (left image) and shows negative values (red points) in ascending and positive values (blue points) in descending data. The section on the right bank of the fjord moves to the northwest (right image) and shows the opposite, positive values in ascending and negative values in descending.

How often are measurements obtained?
The Copernicus Sentinel-1 C-band SAR mission operates the Sentinel-1A and -1B twin space-borne segments. The Sentinel-1 Terrain Observation with Progressive Scan (TOPS) mode offers significant advantages over other sensors because it provides a wide-area coverage and a short revisit time of 6 days over Europe and 12 days globally.
The first satellite was launched in 2014. The temporal resolution of the Sentinel 1-A dataset increased from 12 days until October 2016 to 6 days after the launch and beginning of the operational phase of its twin satellite Sentinel 1-B.
For regional Radasat-2 datasets, the temporal resolution is 24 days. With each overflight, the radar scans a 250-km wide strip of the Earth’s surface. Norway is located so far north that these overflight paths overlap. This means that photos are acquired more often - up to three times a week in the northernmost counties.
InSAR does not work in snowy regions
Data from months with little snow cover (ca June – October) are used for the nationwide data sets. Data from the whole year will be used in urban areas. The datasets are updated once a year in the autumn/winter when data from the summer season has been collected and processed
Further explanations of the temporal resolution and data gaps can be found here.