![[tepat.gif]](/Kola/tepat.gif)
(Photo: C. Reimann)
(Photo: C. Reimann)
The regional geochemical mapping program (1995-1996) was based on sampling at approximately 650 sites within an area of 188,000 km2 comprising all major landmass between the Arctic Circle and the Barents Sea, and between 24 and 35.5 degrees east of longitude (see map).
Field work was carried in summer 1995 in order to coincide with the field work season of the European Moss Atlas Project, and included the collection of terrestrial moss, humus, topsoil (0-5 cm) and podzol profiles. In Russia, lake water was collected as well. Field methods are described in depth in the report by Äyräs & Reimann (1995) and in the Atlas (Reimann et al., 1998), details of which can be found in the publication list. Due to the remoteness of many sampling localities, helicopter transportation was required. Sample preparation, chemical analysis, data analysis, interpretation and reporting of results were carried out subsequently.
|
PODZOL PROFILE STUDY (Photo: C. Reimann)
|
A SAMPLING LOCALITY IN FINNMARK (Photo: C. Reimann)
|
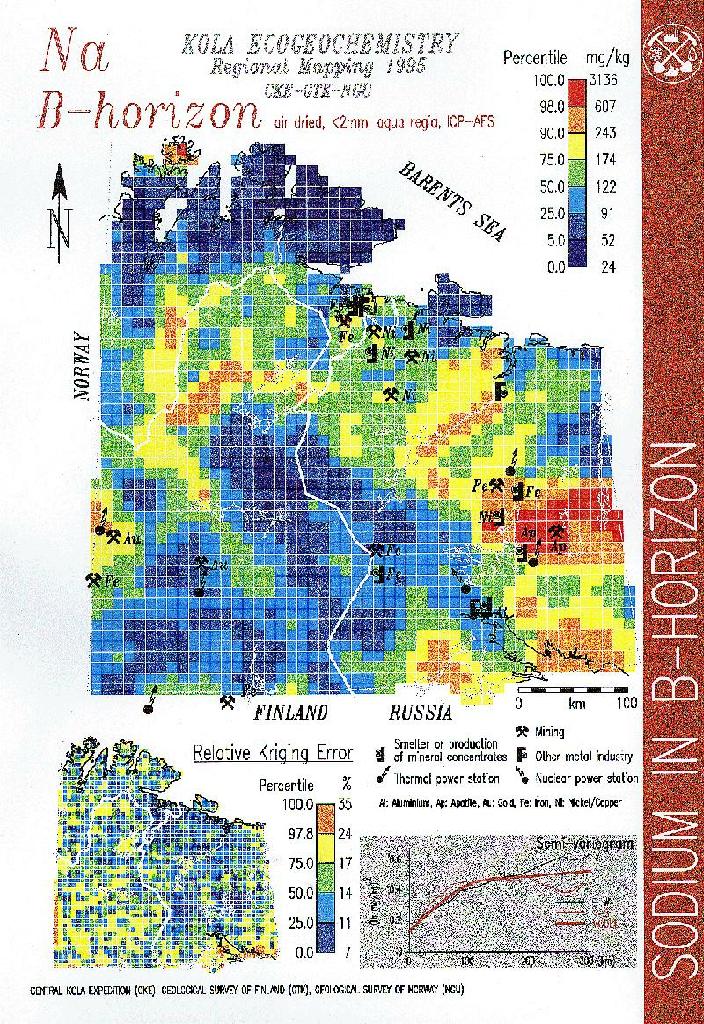
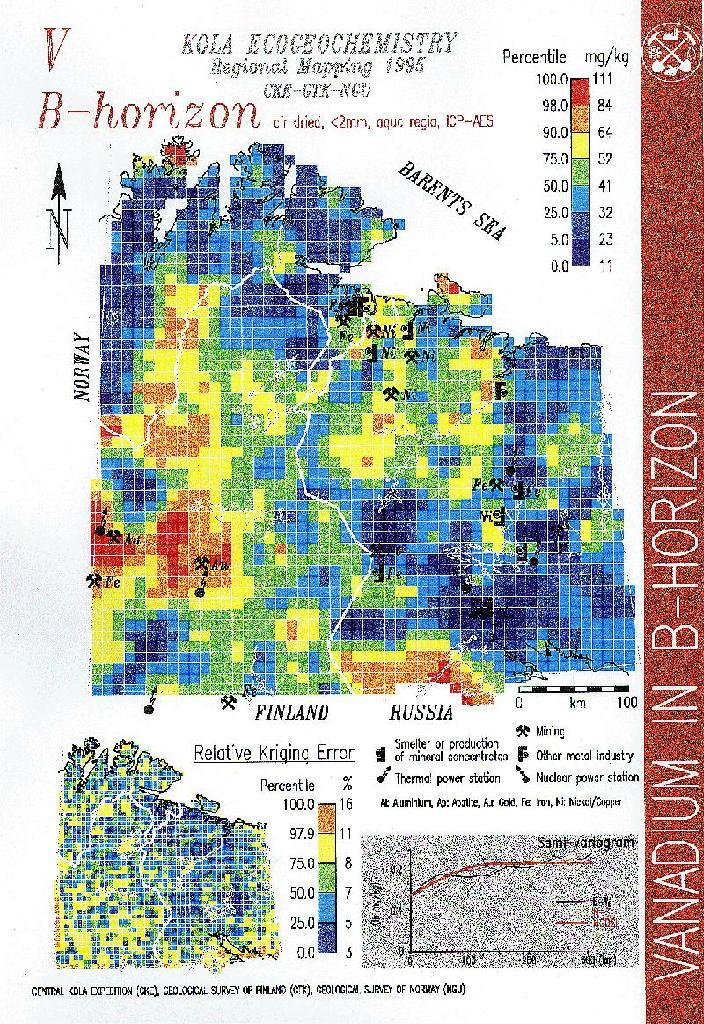
Regional geochemical maps of about 40 elements in four sampling media (moss, humus, B-horizon and C-horizon) constitute the main result of this third phase of the project. A comprehensive Environmental Geochemical Atlas has been prepared (Reimann et al., 1998) and is available for sale. It contains black-and-white point maps of our actual results, together with kriged colour surface maps covering the whole study area. A brief discussion of the data is also presented.
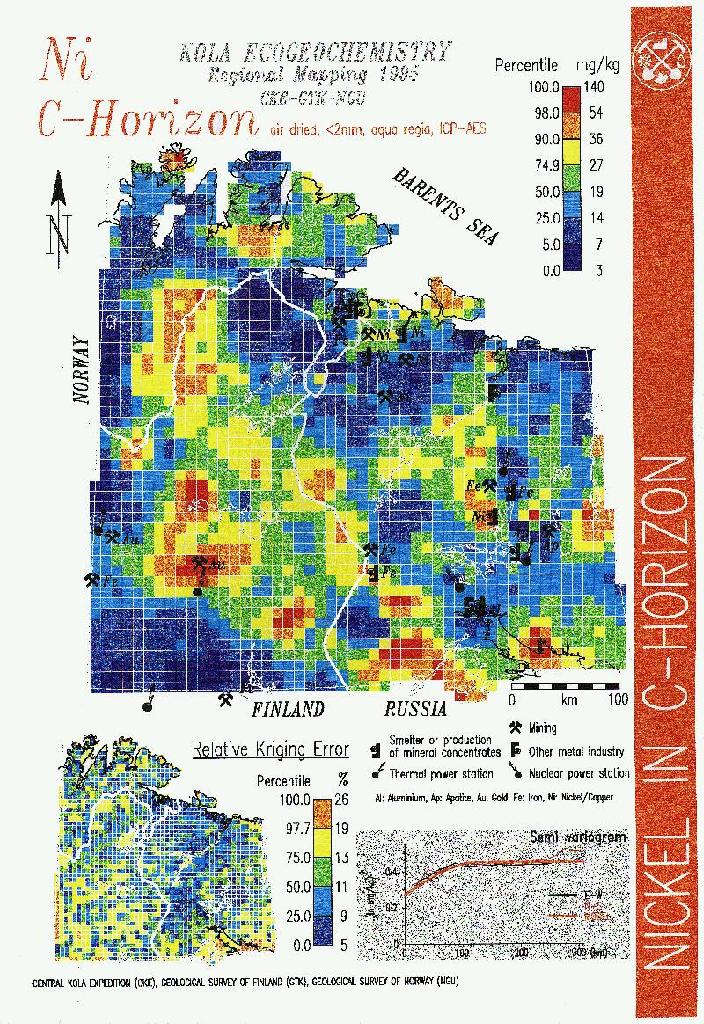
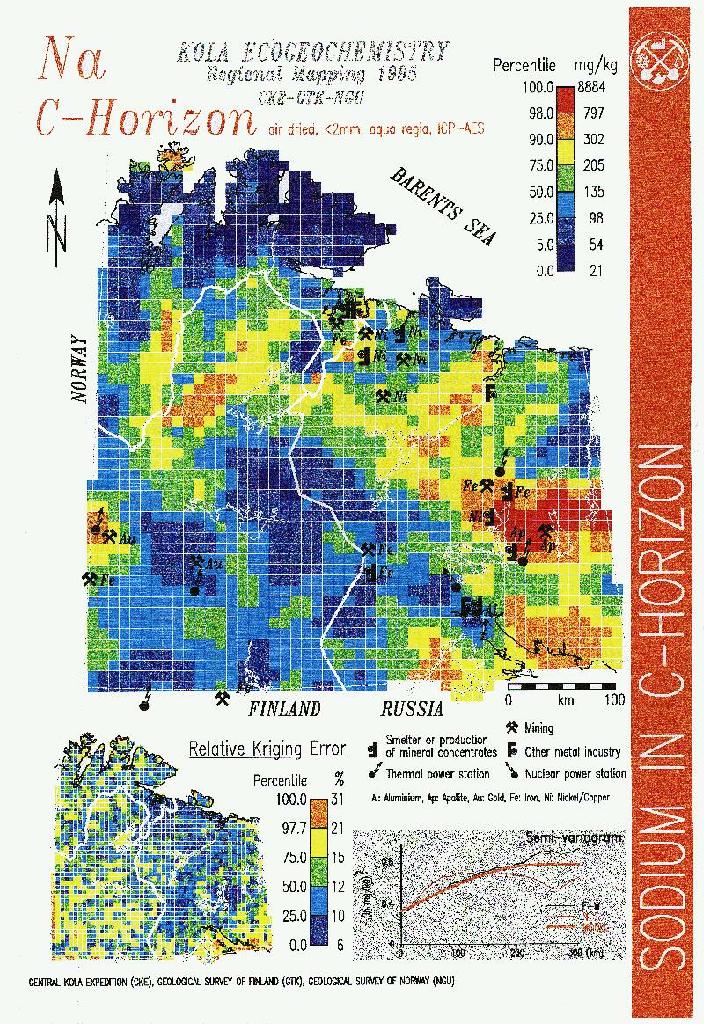
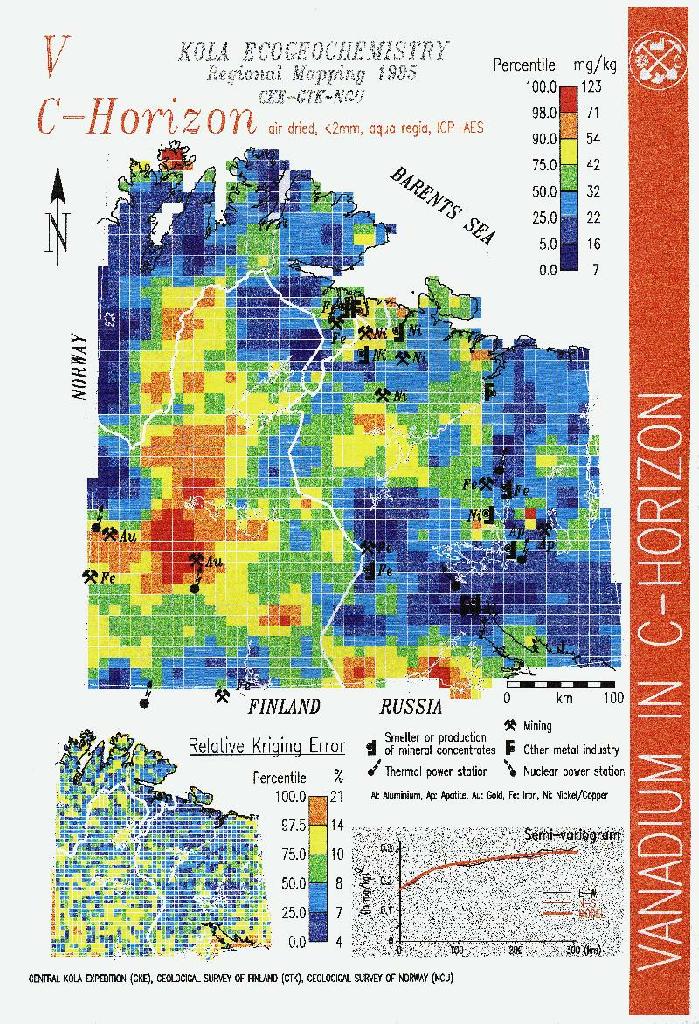
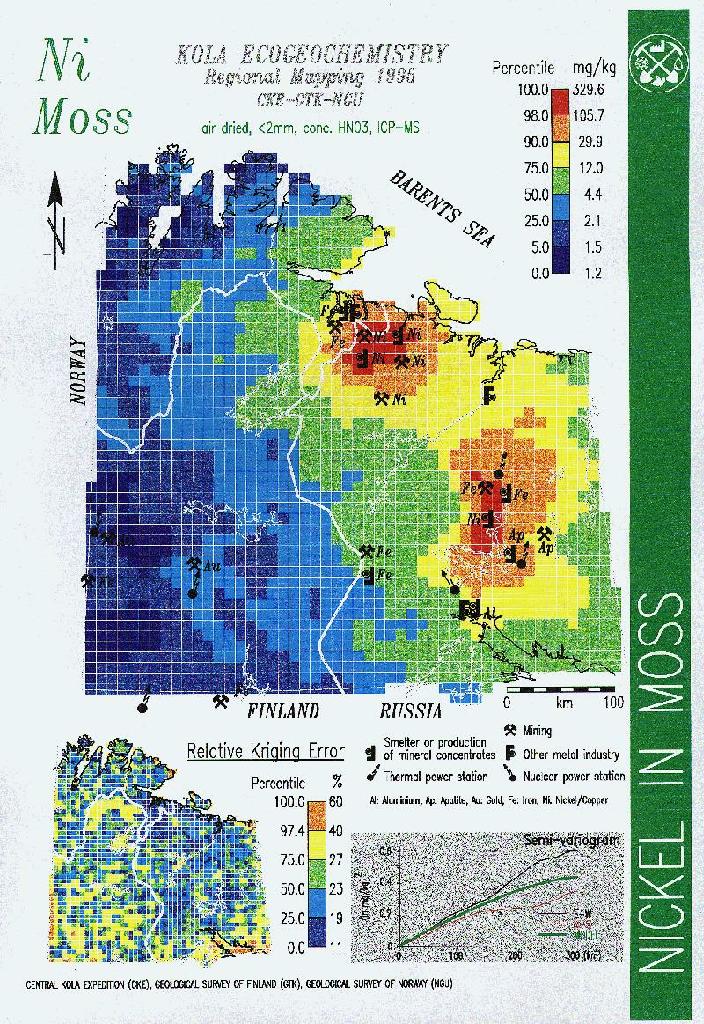
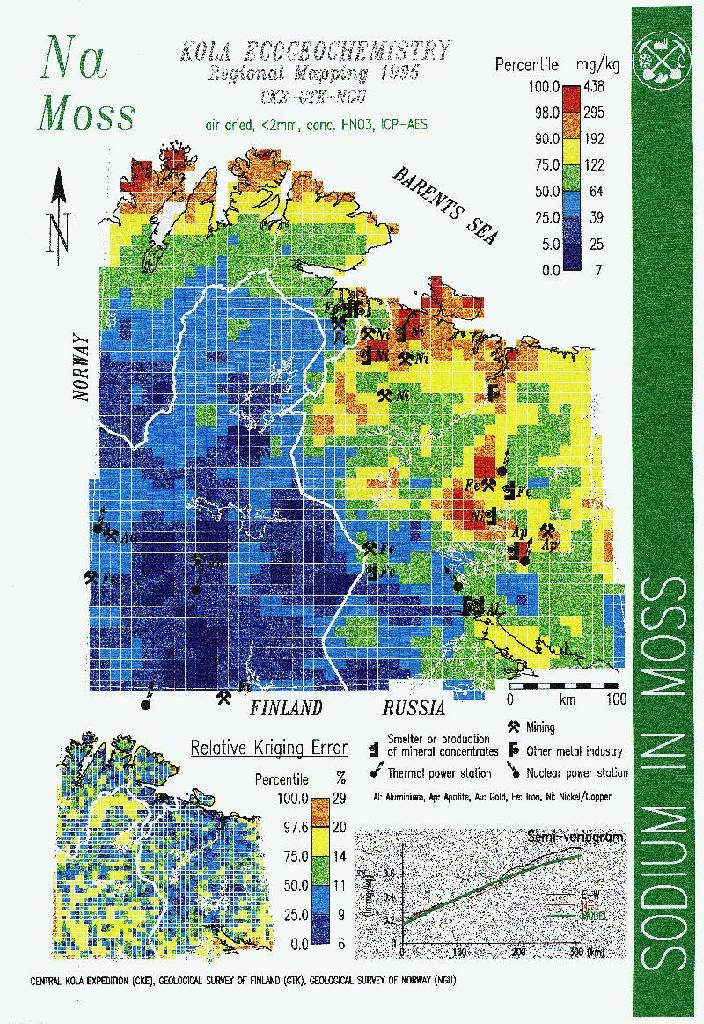
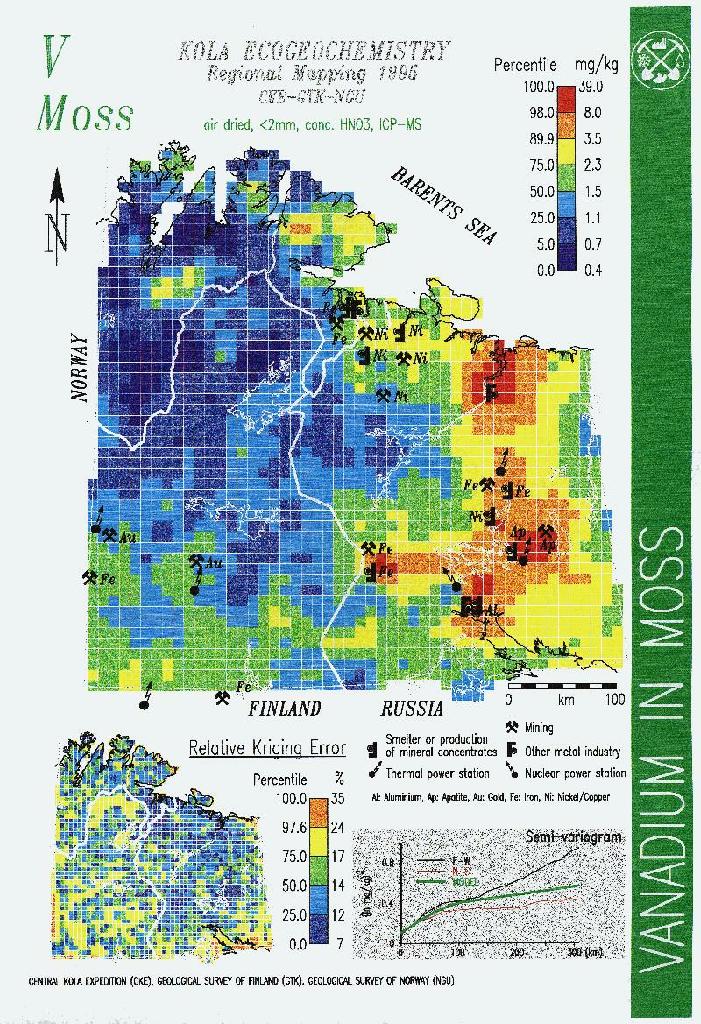
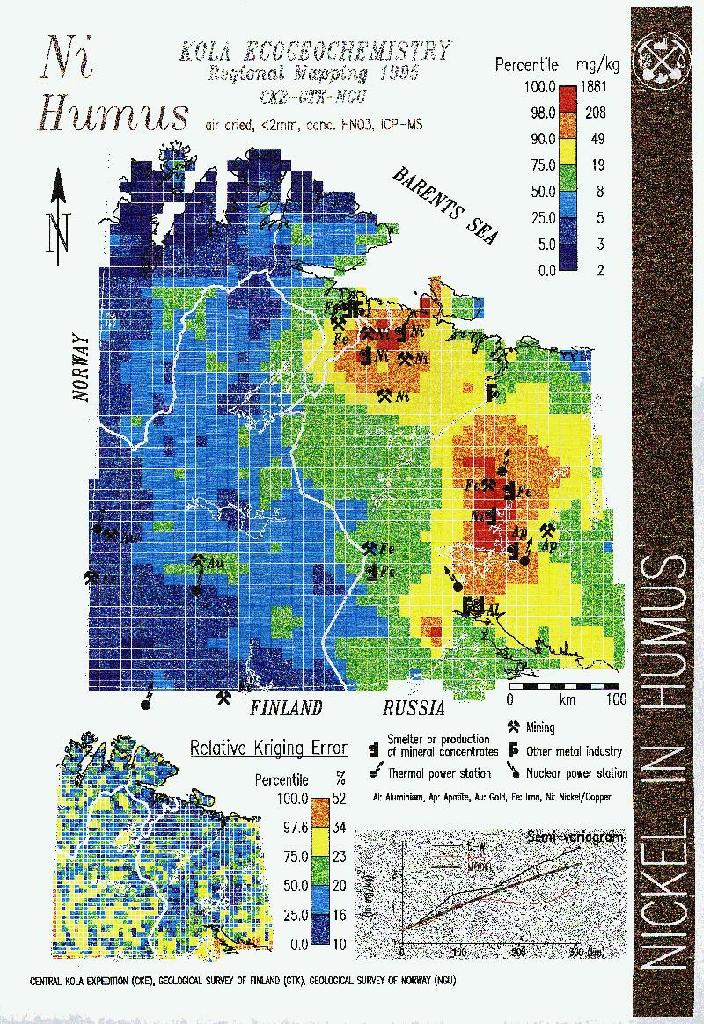
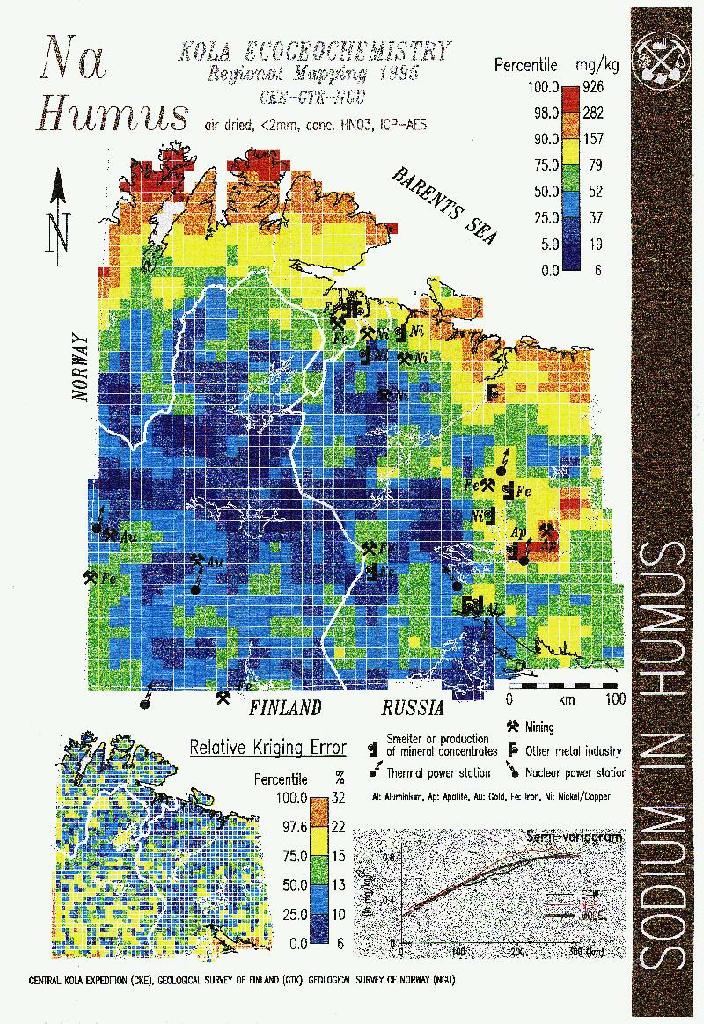
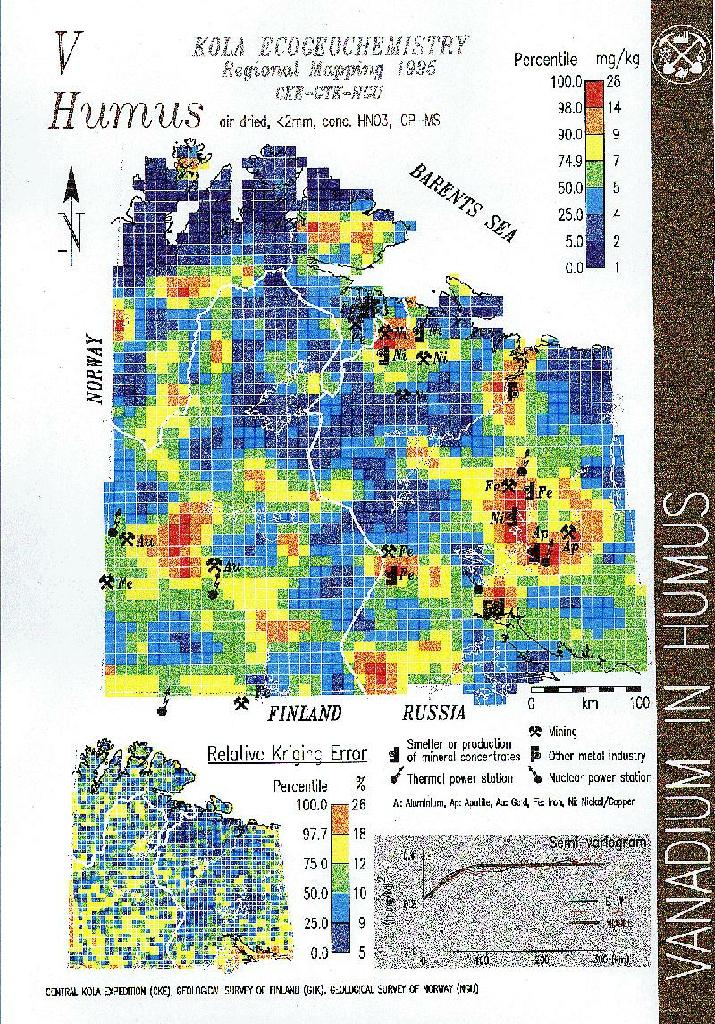
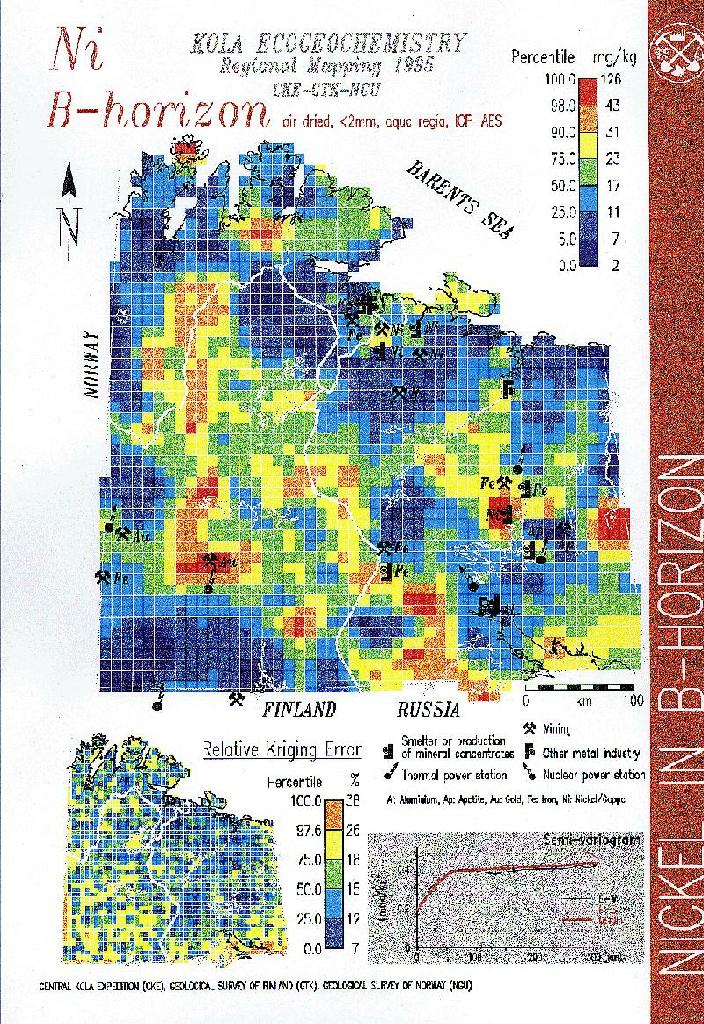
As examples of what the Atlas contains, the following maps show the distribution of Ni, Na and V in moss, humus, B-horizon and C-horizon as colour surface maps.
Two clear technogenic Ni anomalies in the moss map surround the nickel-copper smelters of Monchegorsk and Nikel, as well as the ore roasting plant at Zapoljarnij. The patterns are affected by dominantly N-S wind and topographic directions. Other sources of Ni are the bedrock and till, as shown by the C-horizon map.
The Na maps show the importance of sea spray as a source (see moss and humus maps). In addition, some natural, geogenic sources are distinguishable, particularly the alkaline rocks of the Kirovsk area.
The V maps show again the clear difference in patterns in the moss and the C-horizon media, which reflect the importance of atmospheric sources (pollution) versus geogenic (natural) sources.
Click on any thumbnail map below to open the corresponding full-scale map (A4 size, about 250 Kb JPEG files; maps by DDT).
M
O
S
S
NICKEL
SODIUM
VANADIUM
H
U
M
U
S
B
-
H
O
R
I
Z
O
N
C
-
H
O
R
I
Z
O
N